
When applications are essential to business success, making sure they're always at the top of their game is critical. Among the many monitoring tools available, the Elastic Stack stands out for its ability to handle large data volumes with ease. It not only collects and stores your logs but also delivers incredible visualizations and valuable insights.
In today's post, we'll show how the Elastic Stack can be a faithful partner to keep your applications in shape.
Why monitor applications?
- Availability guarantee: applications must be available 24/7 to meet consumer demand.
Monitoring them helps teams spot failures or service degradations before they hit end users. - Performance and user experience: an application's performance is directly linked to user satisfaction.
Observability lets you identify bottlenecks and optimize processes to keep performance at its best. - Security: proactive monitoring helps detect suspicious activity and possible security breaches, providing continuous protection against attacks or unauthorized access.
- Resource savings: catching problems early avoids excessive spending on emergency maintenance and financial losses from downtime or poor system performance.
Log retention
Keeping historical logs is vital for understanding past behavior, performing forensic analysis on incidents and ensuring regulatory compliance.
With powerful features like Index Lifecycle Management (ILM), Elasticsearch lets you manage log lifecycle, optimizing storage and ensuring that old data is archived or deleted as needed.
Accessible, well-organized logs make audits easier, as well as security investigations, providing crucial information about past events.
Main components of the Elastic Stack
Elasticsearch: service for storing and quickly searching logs and data in real time. Acts as the stack's search engine, handling large volumes of data.
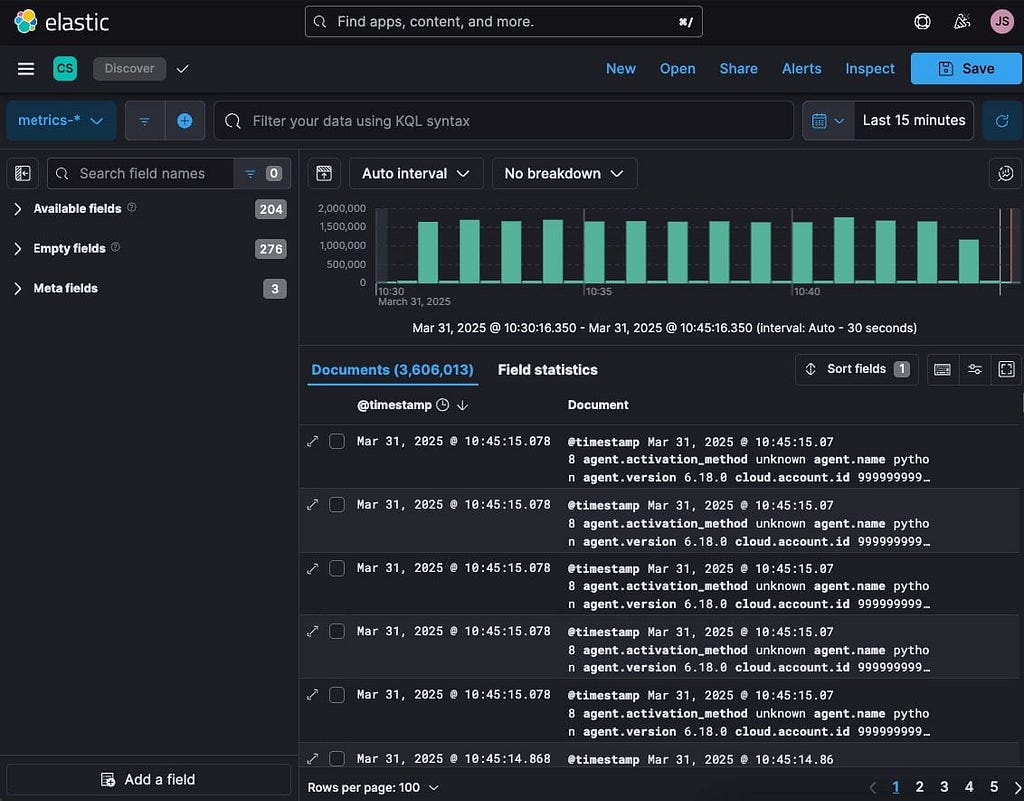
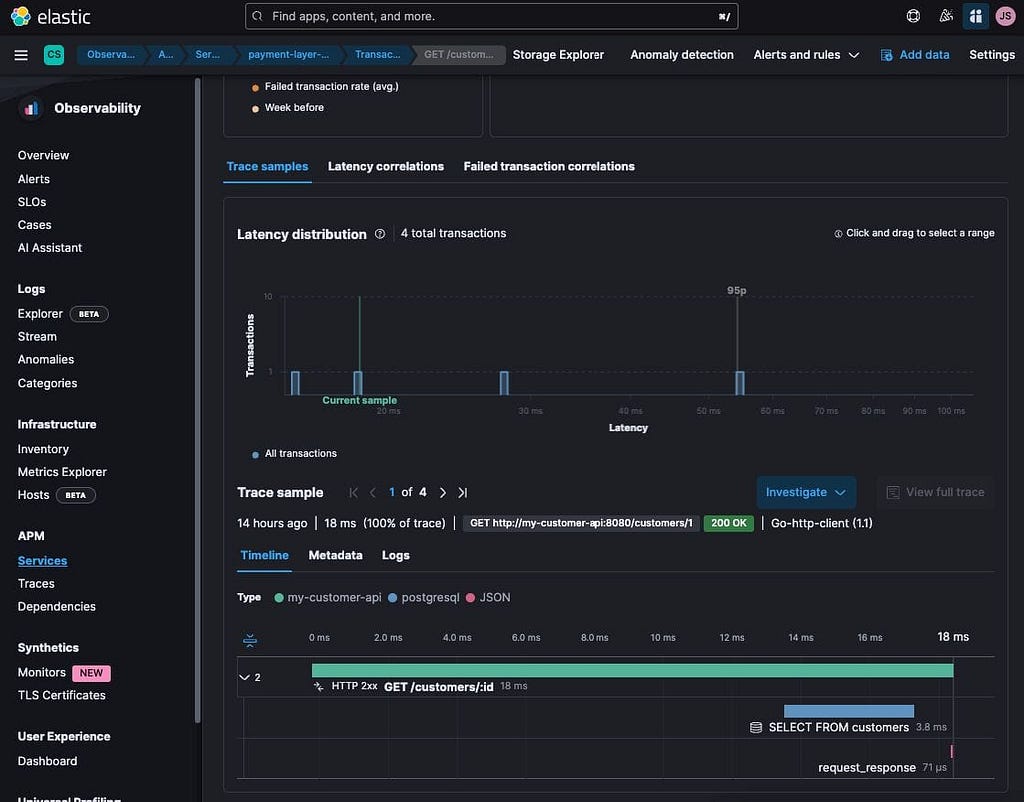
Kibana: visualization platform that lets you build interactive dashboards based on collected data. Through Kibana, operators can monitor application health with configurable graphs and alerts.
Elastic agent: unified tool that collects log data from multiple sources, simplifying the shipping of that information to Elasticsearch. The Elastic agent is known for its simplicity and efficiency in centralized management of log policies.

Choosing the Elastic Stack as your monitoring solution brings a set of notable benefits.
- Scalability: capable of handling large data volumes, the Elastic Stack is ideal for companies of any size, growing as needed without performance loss.
- Customization: both Elasticsearch and Kibana offer flexibility in creating queries and custom dashboards to meet the specific monitoring needs of an organization.
- Simplified integration: with the help of Elastic-Agent, collecting metrics and logs from different systems, platforms and languages happens in an integrated and efficient way, centralizing data management.
- Real-time visibility: the combination of Elasticsearch and Kibana enables real-time data analysis, crucial for immediate action in critical situations.
It's important to remember that the ability to monitor and observe applications is, without question, one of the most valuable assets for any IT team today. With growing software architecture complexity and the pressure to deliver ever more efficient services, tools like the Elastic Stack become essential allies. They provide detailed insights, enable fast incident response and help with informed strategic decisions, keeping application health and performance optimized.
CloudScript integrates and manages the Elastic Stack so your company gets complete, scalable and efficient monitoring. We combine Elasticsearch, Kibana, Prometheus and Grafana to offer total visibility of your environment, with intelligent alerts and automation.
Need a robust, hassle-free solution? TALK TO CLOUDSCRIPT.