Ever had that “where did I go wrong?” moment while debugging your application? Well, instrumenting your application is almost like placing a security camera to monitor everything happening under the hood. And of course, Elastic APM and Kibana are a dynamic duo for that job.
If you’re developing in Golang and want full control over what’s happening in your application (and avoid nasty surprises), it’s time to integrate everything with Elastic APM. The best part: there are libraries that do the heavy lifting for you! Let’s take a look at some?
What is Elastic APM and why do you need it?
Elastic APM is basically the detective you hire to investigate everything happening in your application. It monitors performance, flags errors, and gives you a nicely laid out report in Kibana, all in real time. And since it has a ready-made implementation for Go, you can integrate it into your code in no time.
Now, if you’re thinking “cool, but I already use a logger in my app”, no worries! Several Go logger libraries already ship with APM implementations, which makes life easier for everyone.
Why echo + zerolog?
If you don’t know Echo yet, it’s the “Formula 1 car” of web frameworks in the Go world. Fast, efficient, and with an API that makes building REST APIs a breeze. Now, when you pair it with Zerolog, a super fast and minimalist logging library, you get a powerful combo.
Let’s get to it!
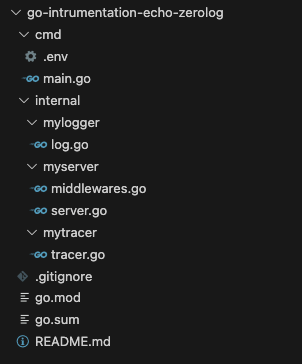
First, let’s structure our application. In this example we’ll need 3 custom packages:
- mylogger — to initialize our logger and standardize log calls
- mytracer — to initialize the APM tracer of our application, centralizing the required configurations
- myserver — to start the application server with the routes we’ll use
It’ll look like this:
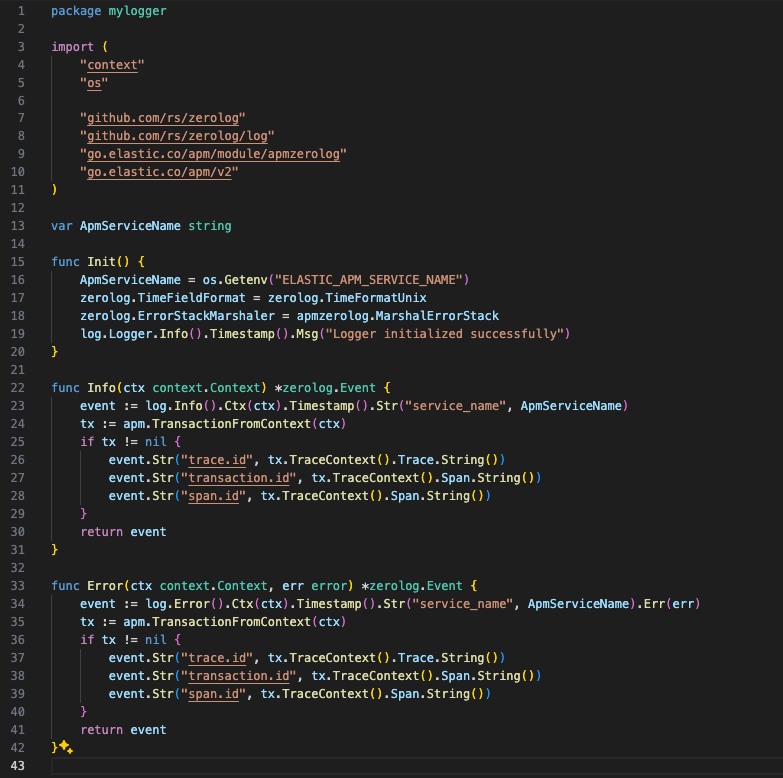
Package: mylogger
Here we have the Init() method where we configure the application’s logger, plus two log-event methods we’ll use as needed. In those events we already centralize some information that will be added to the logs through the context, like trace details, service name, and error when relevant.
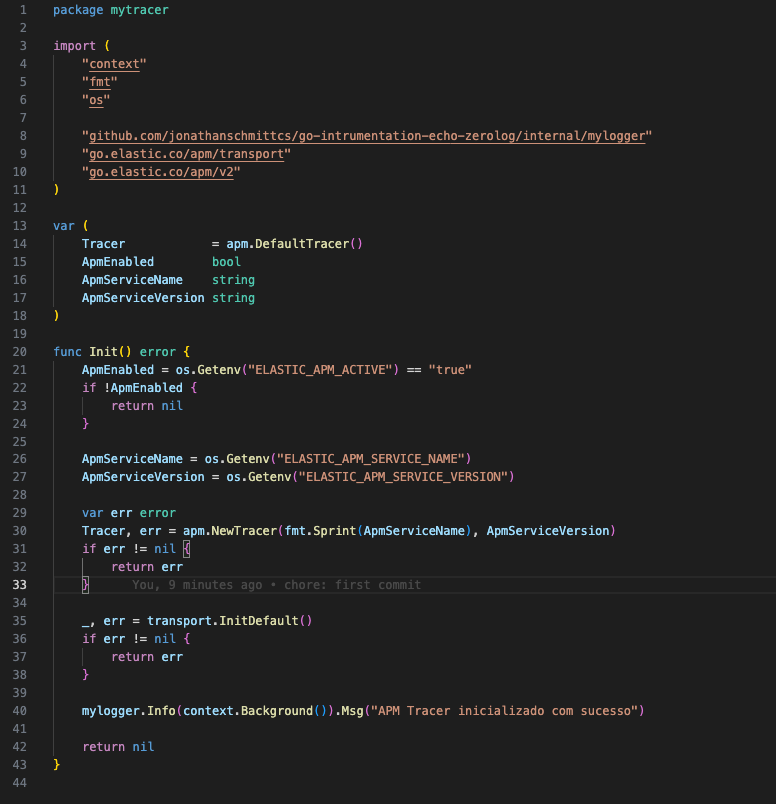
Package: mytracer
Here we initialize the APM Tracer, which is what ships logs to Kibana.
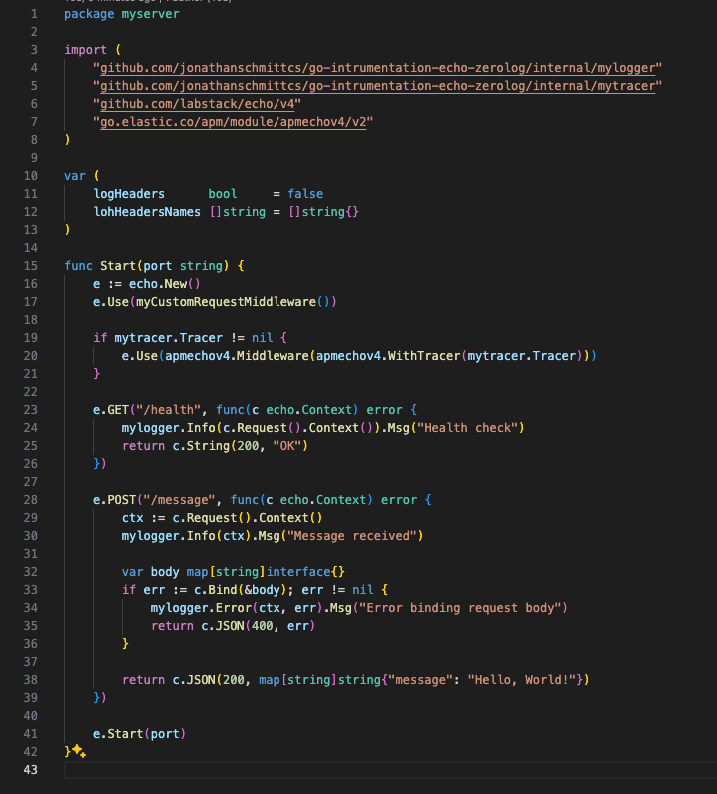
Package: myserver
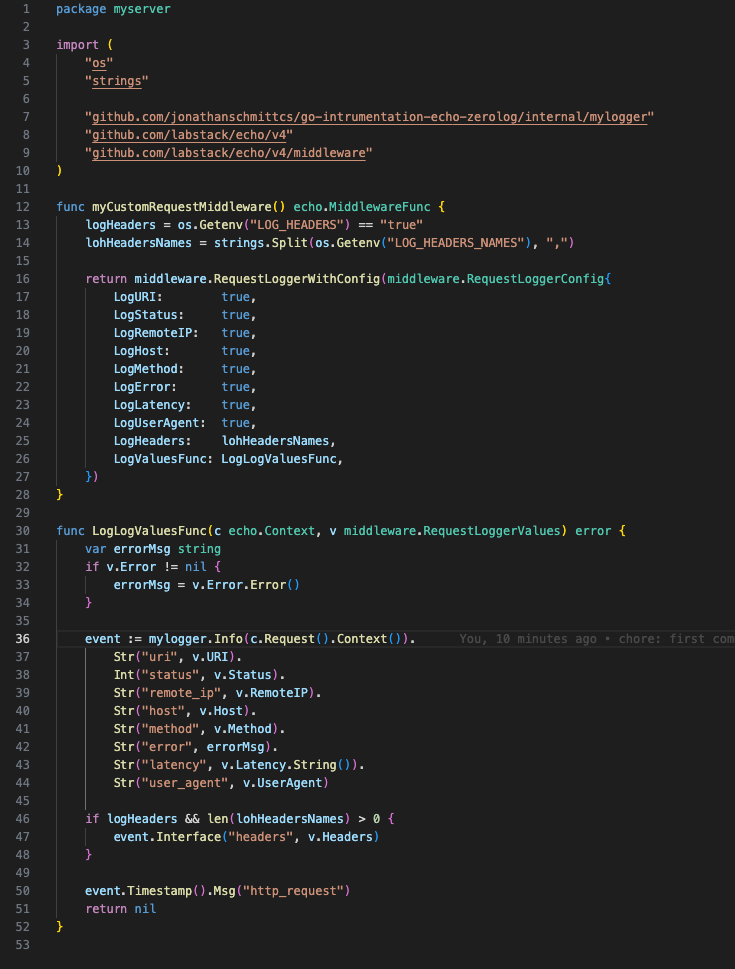
Here we start our application server and add our routes. We also add a custom middleware to log requests in the application console, plus the apmecho middleware where we pass the tracer we created earlier so APM can capture requests and send them to Kibana automatically.
Here’s our custom middleware, which lets us format the log however we want and log the headers we configured in our environment variables.
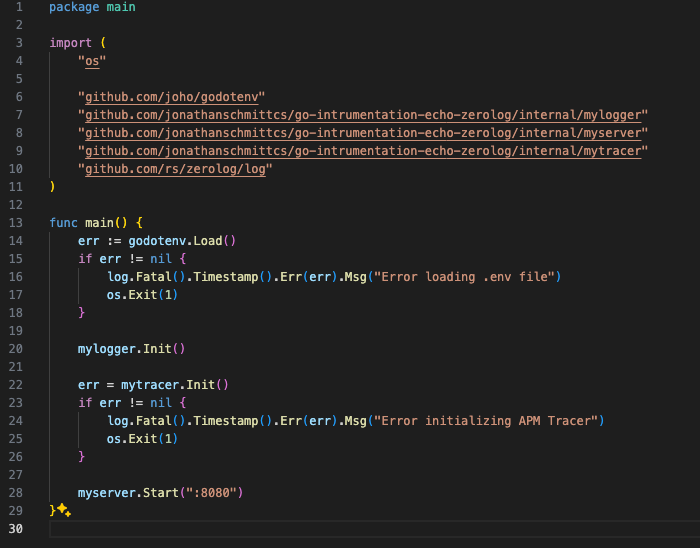
Package: main
To wrap up our application, let’s create the main.go file where we’ll initialize logger, tracer, and the server of our application.
Configuring the environment
In the ./cmd/ directory let’s add the .env file with the variables below so the APM tracer is properly configured in our application.
ELASTIC_APM_SERVICE_NAME=my-app
ELASTIC_APM_SECRET_TOKEN=
ELASTIC_APM_SERVER_URL=http://localhost:8200
ELASTIC_APM_ENVIRONMENT=local
ELASTIC_APM_ENABLED=true
ELASTIC_APM_ACTIVE=true
ELASTIC_APM_LOG_LEVEL=debug
ELASTIC_APM_LOG_FILE=stderr
ELASTIC_APM_SERVICE_VERSION=1.0.0
ELASTIC_APM_CAPTURE_BODY=all
ELASTIC_APM_SANITIZE_FIELD_NAMES=password,secret,passwd,pwd,token #only for POST form fields
LOG_HEADERS=true
LOG_HEADERS_NAMES=header1,header2
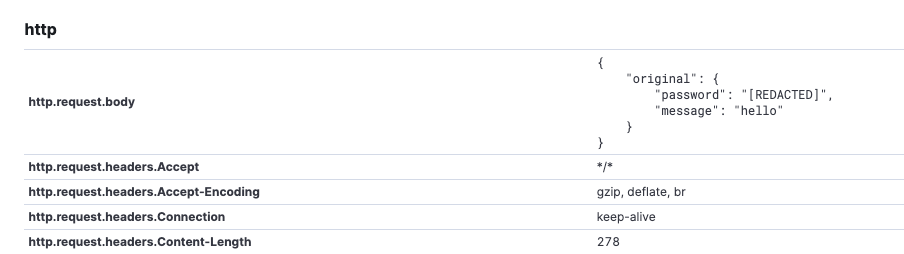
With these settings we expect the request body to be captured and sent to APM, sensitive field values submitted in the form to be replaced with [REDACTED] (currently this only works when requests use form-data fields), and some headers to be logged to the application console when the request is received.
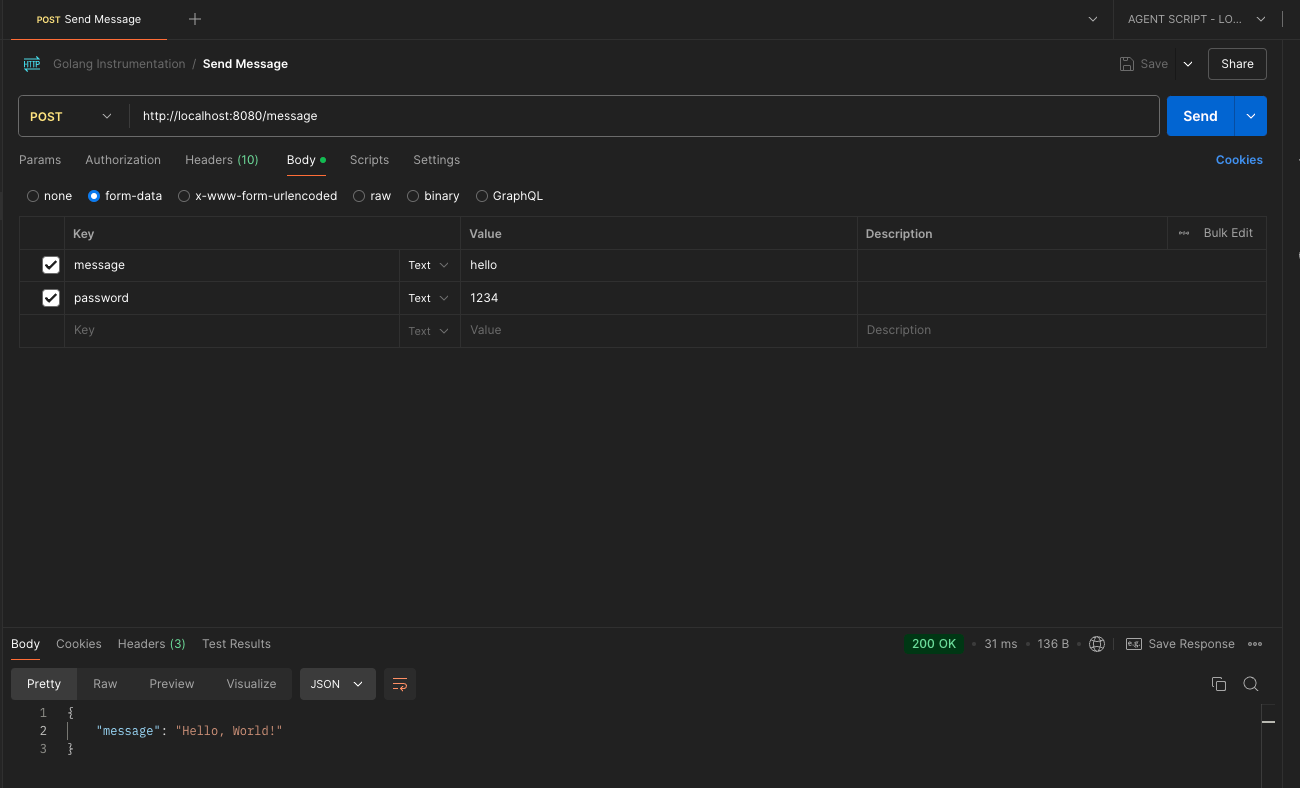
Now let’s hit our application to see the logs in the application console and the transactions in Elastic Kibana.
These are the logs we get:
{"level":"info","time":1729797526,"service_name":"my-app","trace.id":"a50295e9e1de4956b024b83544bf6d65","transaction.id":"a50295e9e1de4956","span.id":"a50295e9e1de4956","time":1729797526,"message":"Message received"}

{"level":"info","time":1729797526,"service_name":"my-app","trace.id":"a50295e9e1de4956b024b83544bf6d65","transaction.id":"a50295e9e1de4956","span.id":"a50295e9e1de4956","uri":"/message","status":200,"remote_ip":"::1","host":"localhost:8080","method":"POST","error":"","latency":"3.074167ms","user_agent":"PostmanRuntime/7.42.0","headers":{"Header1":["hello"],"Header2":["world"]},"time":1729797526,"time":1729797526,"message":"http_request"}

{"level":"debug","time":"2024-10-24T16:18:49-03:00","message":"sent request with 1 transaction, 0 spans, 0 errors, 1 metricset"}
{"level":"debug","time":"2024-10-24T16:19:09-03:00","message":"gathering metrics"}
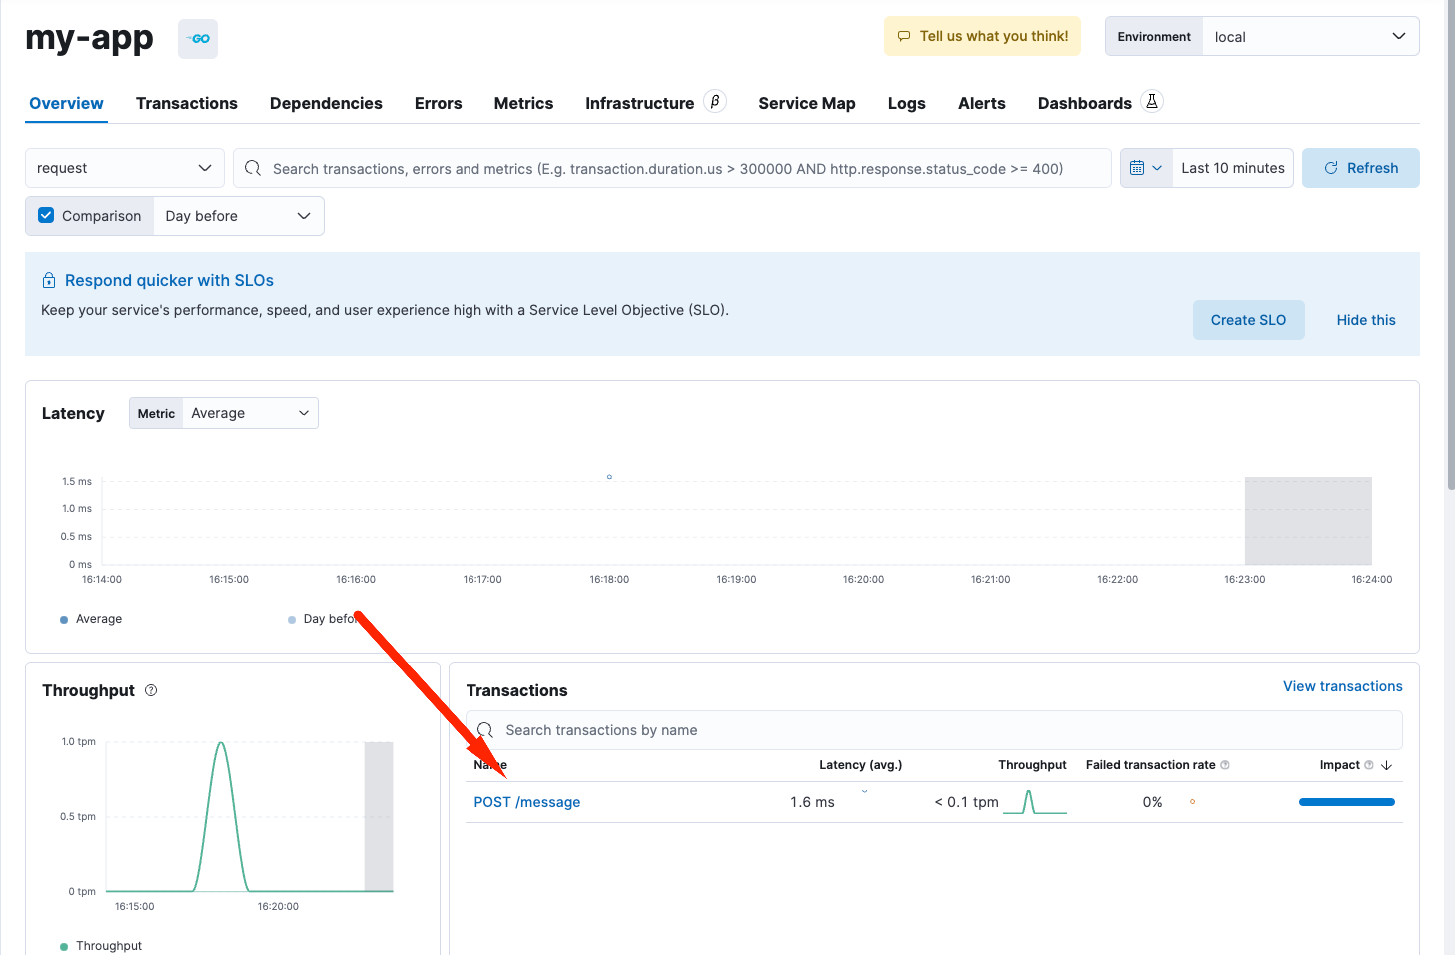
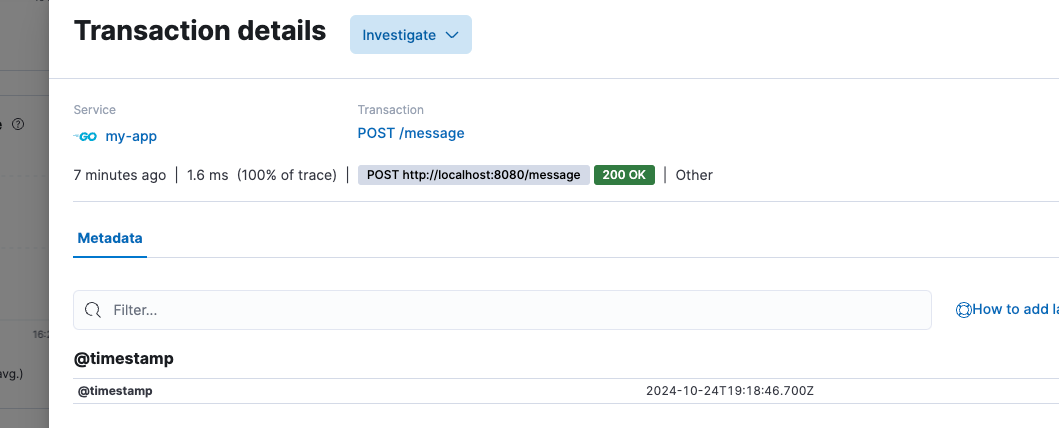
Visualizing the request in Elastic Kibana:
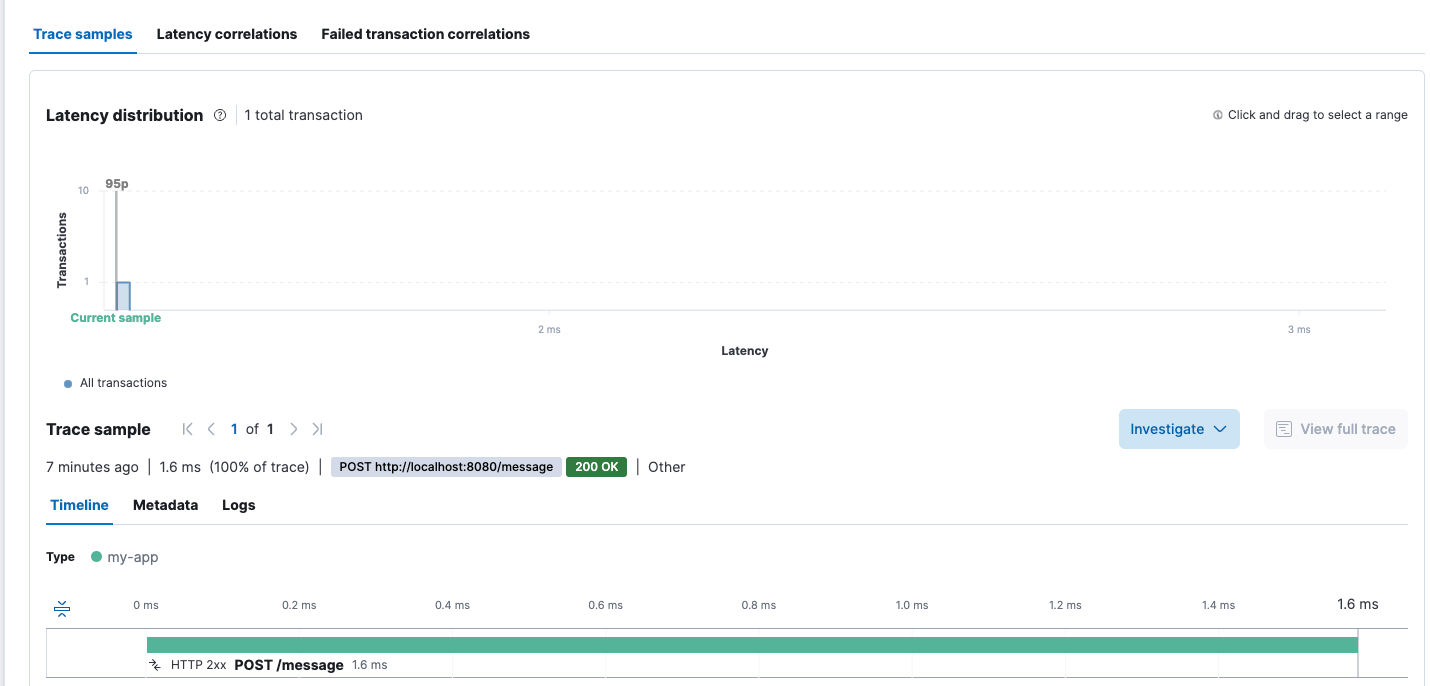
How all of this makes your life easier
Picture the scene: your application is running and suddenly you notice something is off. Without an APM, you’d be stuck, hot-headed, hunting down the issue inside containers and reading hundreds of logs to understand it. But with instrumentation properly set up, you just open Kibana and there’s the villain of the story: logs, metrics, errors, all organized and ready for analysis.
The best part of using these libraries is that you don’t need to reinvent the wheel. They already ship with the integration to Elastic APM, which means less manual work and more time focused on what really matters: building amazing applications!
So, ready to monitor everything?
Instrumenting your Go application with Elastic APM and Kibana is almost like handing yourself a superpower. You’ll have full control over what’s happening, spot bottlenecks, and avoid future headaches. And best of all: these logging libraries do all the heavy lifting for you.
Don’t forget! We at CloudScript are here to support you whenever you need.
Repository used in the example: https://github.com/jonathanschmittcs/go-intrumentation-echo-zerolog
Cheers,
Jonathan Schmitt.
 Helias Rodrigues
SEE ALSO
Jonathan Schmitt
SEE ALSO